Lineage and Visualization
As your setup grows, the increasing complexity can make it hard to keep track of all objects and their dependencies. To help you with this, Timextender Data Integration (TDI) offers these visualization features: Data lineage and Relation Diagram. The relation diagram is only available on tables, while Data lineage is available for fields and measures in both Prepare and Deliver instances.
The purpose of data lineage is to show you where the object in question gets its data from. The relation diagram shows you the relations to and from the table in question.
Note
Note: It is recommended to save all changes in the instance before generating data lineage.
Showing Data Lineage or Relation Diagrams
To show data lineage, right click on a field, click Data Lineage:
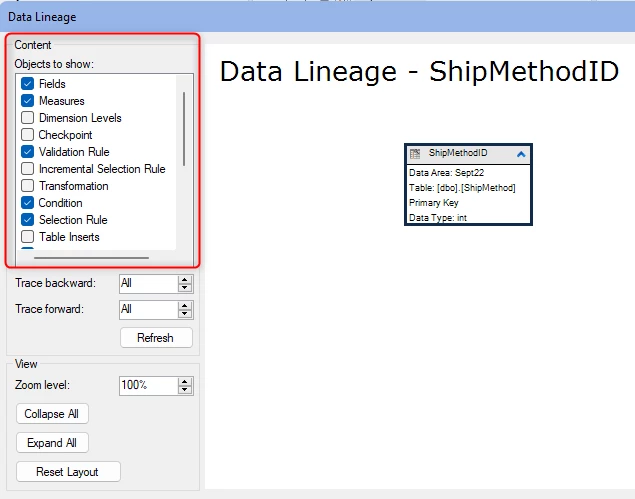
Under Content section (on top-left) check boxes for objects to show, then click the refresh button to showthe lineage.
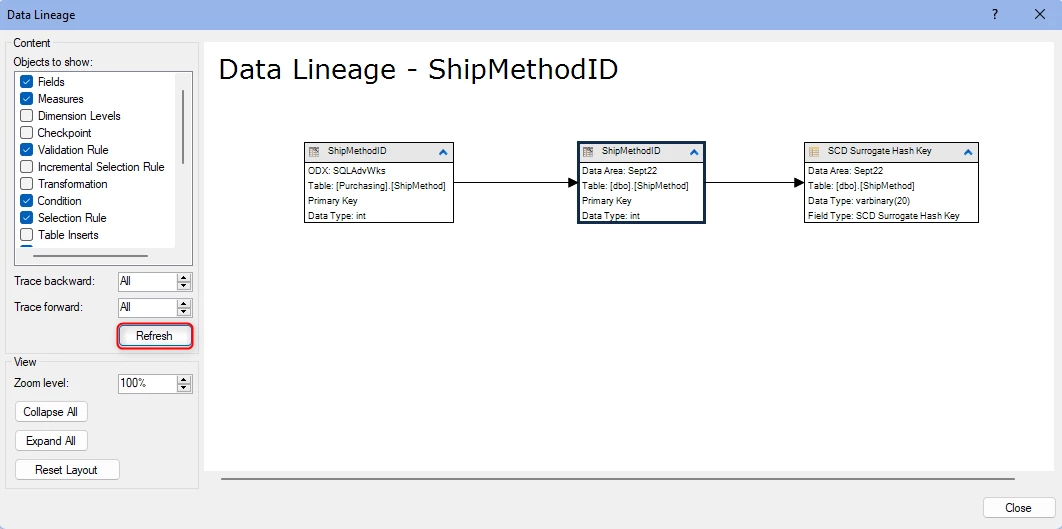
Customizing the Display
In the visualization window, you have different options to customize the display:
-
Click an object to have the connections to and from the object highlighted.
-
Click and hold on an object to move it around and release the mouse button to place it.
- Click the arrow in the header of an object to hide or show object details.
- Right-click the background in the window to bring up a menu with different options for organizing and displaying the data:
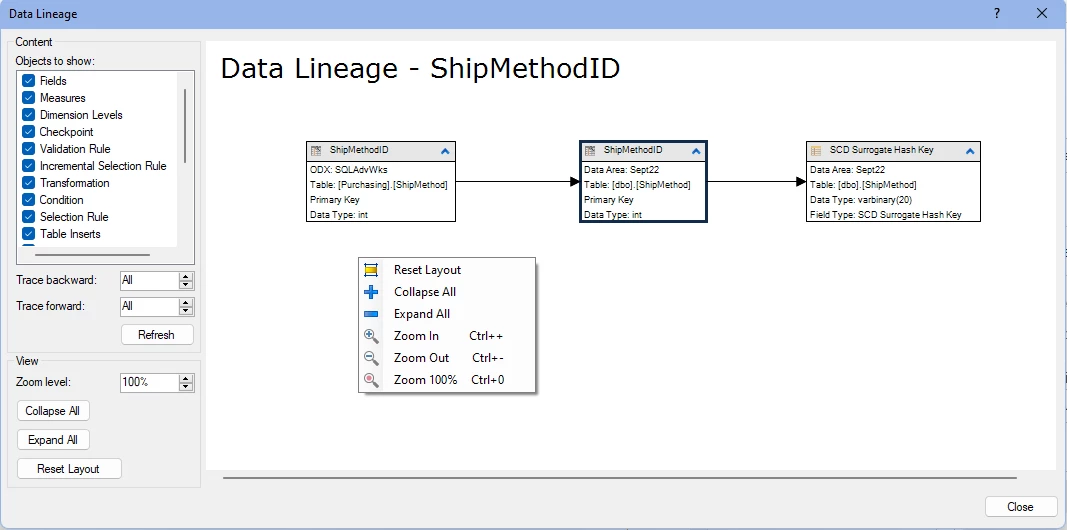
- Click Reset Layout to make TDI reset the layout.
- Click Collapse All or Expand All to either collapse the objects to create a better overview, or expand the objects to see more details.
- Click Zoom In, Zoom Out or Zoom 100% change the size of objects.
Discussed in the community
Looking for related questions…
Didn't find your answer? Ask the community about this page — questions are answered by Timextender experts, partners and other users.