Optimization
Using native features to optimize data warehouse performance.
In this module: performance recommendations · index automation · achieving optimal performance · system fields
SQL Database Cleanup Tool
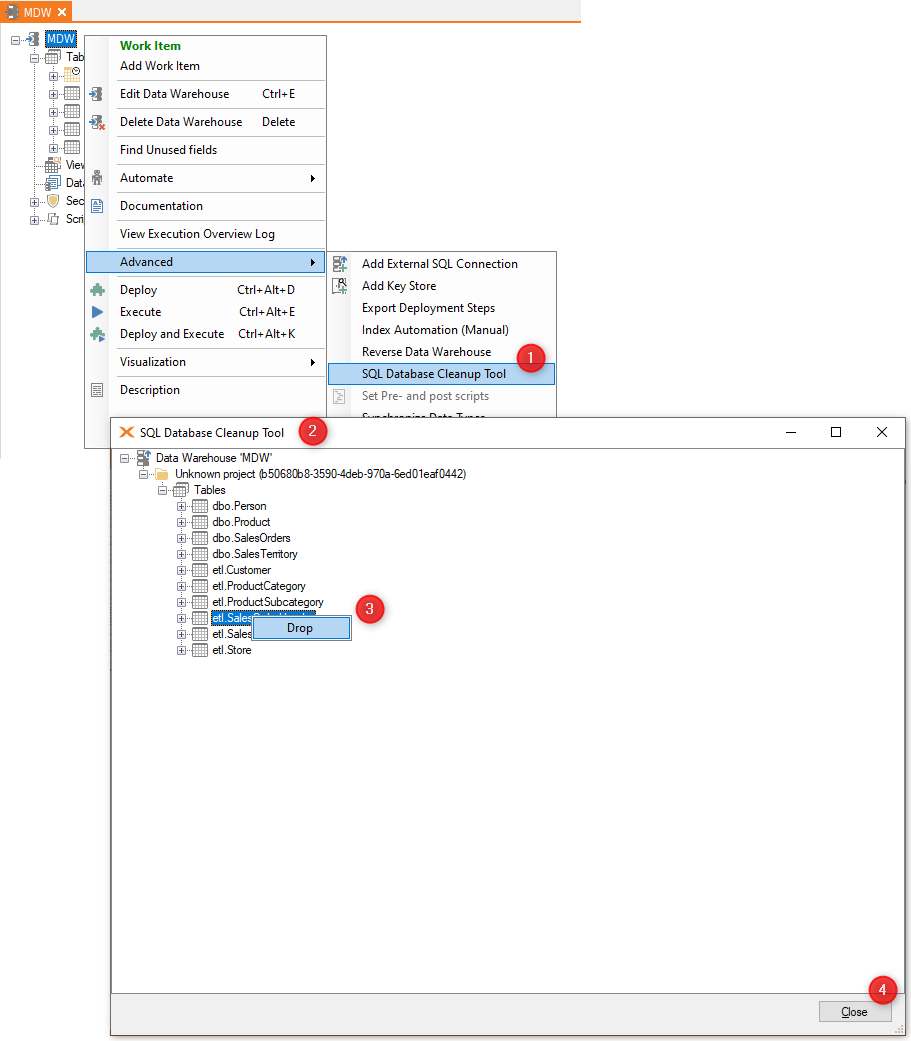
When objects are deleted in Timextender, only the instance — "metadata" — objects are removed, to prevent data loss. That can leave tables, views and stored procedures orphaned in the database, taking up space. The SQL Database Cleanup Tool scans the database, identifies those orphaned objects, and lets you drop them from within Timextender Desktop.
Note
The tool only identifies tables you have deleted from data areas in your data warehouse instance. If you haven't deleted anything yet, the scan may return nothing.
- Open SQL Database Cleanup Tool from Advanced on a data warehouse.
- The list shows objects in the database that are not part of the project, or never were.
- Select an object to drop, such as a table or view.
- When you have dropped everything you intend to, close the window.
Reference: Storage Cleanup Tool
Execution Overview Log
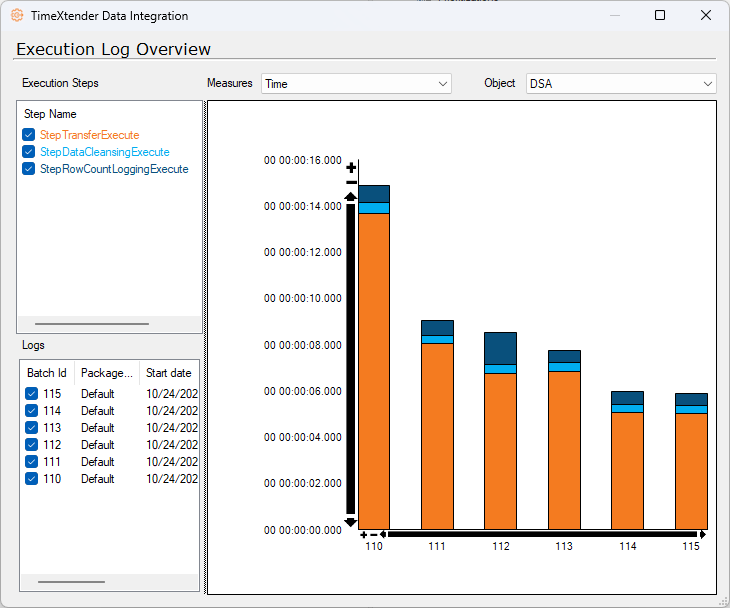
Use the Execution Overview Log to visualise and compare table execution performance over time, so bottlenecks are easy to spot and to validate after tuning. Include the chart in performance reviews to confirm whether Simple Mode, batch data cleansing, compression or indexing actually reduced runtime.
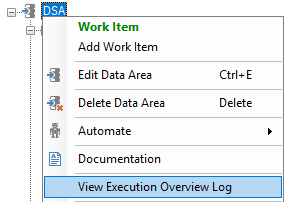
- Open it by right-clicking any table or data area, for example
DSA. - Select execution steps — transfer, data cleansing, row count logging — to show stacked bar contributions and identify which stage dominates runtime.
- Switch object and measures to analyse specific tables, or to see row counts over time.
- After any tuning change, run a controlled re-execution and capture the updated chart to document measurable gains.
- Multi-select historical batch IDs; bars render side by side so improvements or regressions are immediately visible. Hover a stack to read exact durations and compare deltas — for example after enabling page compression or adjusting indexes.
Reference: Execution Performance Monitoring and Troubleshooting
Performance recommendations
The Performance Recommendations tool analyses your project and suggests table setting changes that take advantage of newer features. You review the suggestions and choose which to apply.
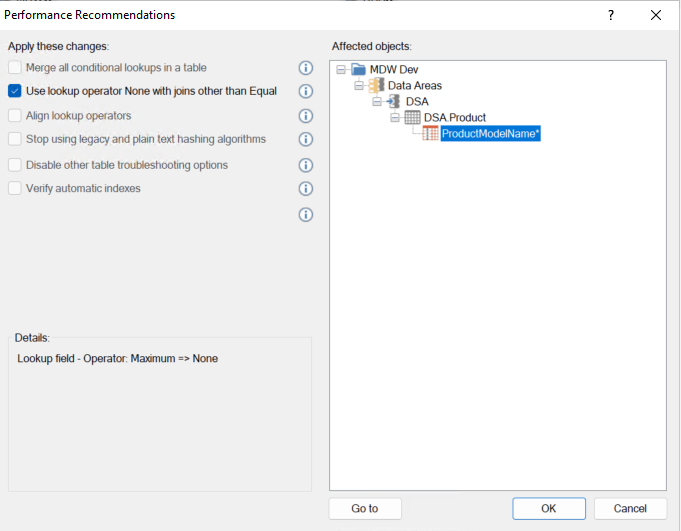
- On the Tools menu, point to Performance Recommendations and click Find.
- Review the recommendations in the Apply these changes list, and clear the checkbox for any you don't want.
- Hover objects under Affected objects to see the issue identified and the proposed change.
- Click OK to apply.
Reference: Performance Recommendations
Simple Mode
Simple Mode dramatically improves table execution times by removing the raw table and the transformation view — which also disables lookups, transformations and validations. Because it still supports incremental load, it suits the presentation layer, where data has already been transformed upstream and only needs mapping and delivering.
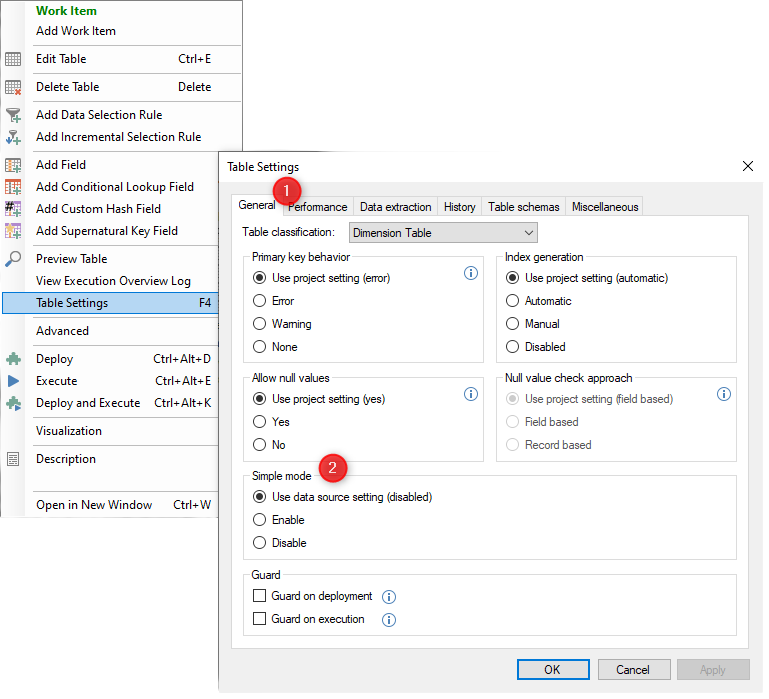
Enable it: open the General tab under Table Settings on a table, and select Enable under Simple mode.
Reference: Simple mode
Table performance settings
There are several ways to improve a table's performance — batch data cleansing, compression, partitioning — but not all options are available for every table type. On Azure Synapse Analytics, the Distribution option determines how data spreads across the server's 60 distributions and compute nodes.
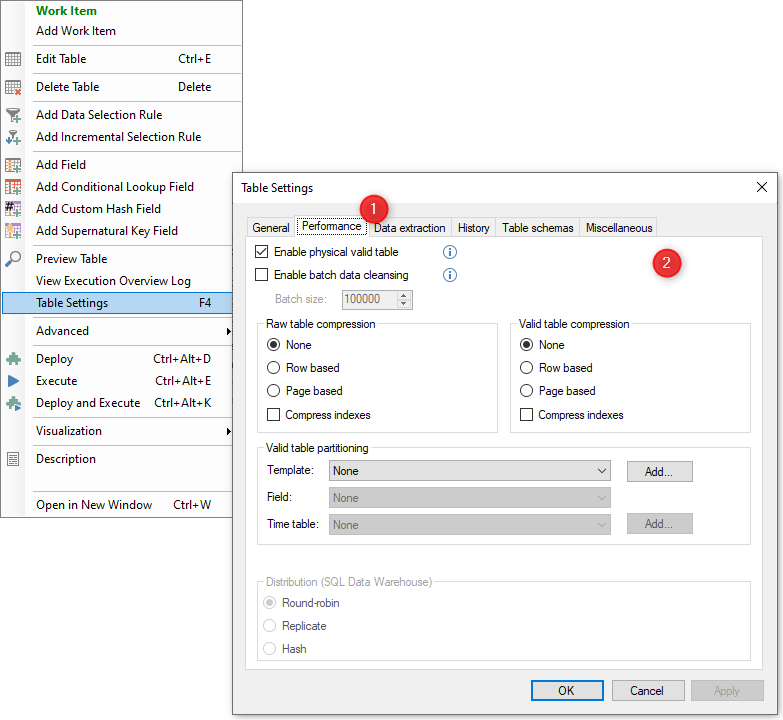
Open the General tab under Table Settings and choose the options that apply.
| Setting | What it does |
|---|---|
| Enable Physical Valid Table | Disabling replaces the valid table with a database view, saving storage but potentially slowing queries. Suitable when storage is constrained and query speed is not the priority. |
| Enable Batch Data Cleansing | Moving all raw records to valid during execution can inflate the SQL log and cause errors on large tables. Batch transfer avoids this, reducing logging overhead at a slightly slower transfer rate. |
| Raw and Valid table compression | Improves I/O-intensive workloads at the cost of CPU on the database server. If CPU is available but I/O is the bottleneck, compression gives significant gains. Usually recommended on both raw and valid tables. |
| Row or page-based compression | Row-based compresses each row individually; page-based compresses further using additional methods. Page-based gives the greatest space and I/O savings but uses the most CPU. Row-based is a good middle ground. |
| Table partitioning | Divides large tables into units across multiple file groups. Queries touching a single partition run faster, and partitions are invisible to external applications. |
Reference: Indexes · How to configure Table Partitioning · Set Distribution for Tables on Azure Synapse Analytics
Next in the course
Table Transformations · Slowly Changing Dimensions
Discussed in the community
Looking for related questions…
Didn't find your answer? Ask the community about this page — questions are answered by Timextender experts, partners and other users.